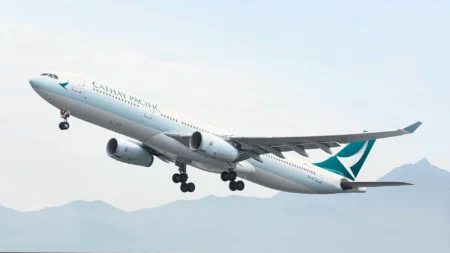
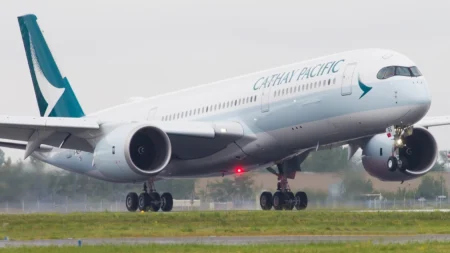
HONG KONG- Cathay Pacific (CX) continues its recovery efforts with significant growth across both short/medium-haul and long-haul networks, achieving 73% and 41% increases in passenger volume, respectively, over the previous 12 months.
The airline maintains dominant market positions in key regional markets while facing stronger competitive challenges on long-haul routes, particularly to North America and Europe, where it ranks third and fifth, respectively.
Cathay Pacific Busiest Routes
The short and medium-haul network (routes under 2,500nm) represents 38% of Cathay Pacific’s (CX) total ASK deployment but serves over 16 million passengers annually, a 73% increase compared to the previous period.
This network generated more than $3.6 billion in ticket revenue over the last 12 months.
Cathay Pacific maintains market dominance in its core regional markets, holding the #1 ranking across key regions:
- Hong Kong-Japan: 51% market share (23% of S/M-haul ASK)
- Hong Kong-China: 49% market share (16% of S/M-haul ASK)
- Hong Kong-India: 84% market share (9% of S/M-haul ASK)
- Hong Kong-Indonesia: 75% market share (9% of S/M-haul ASK)
- Hong Kong-Singapore: 57% market share (8% of S/M-haul ASK)
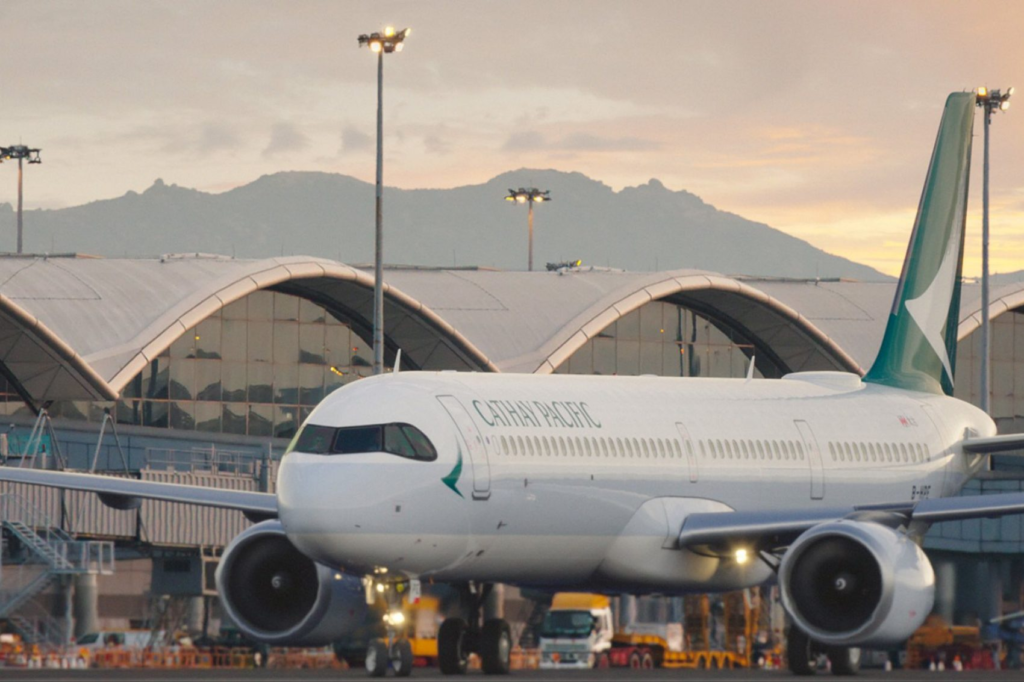
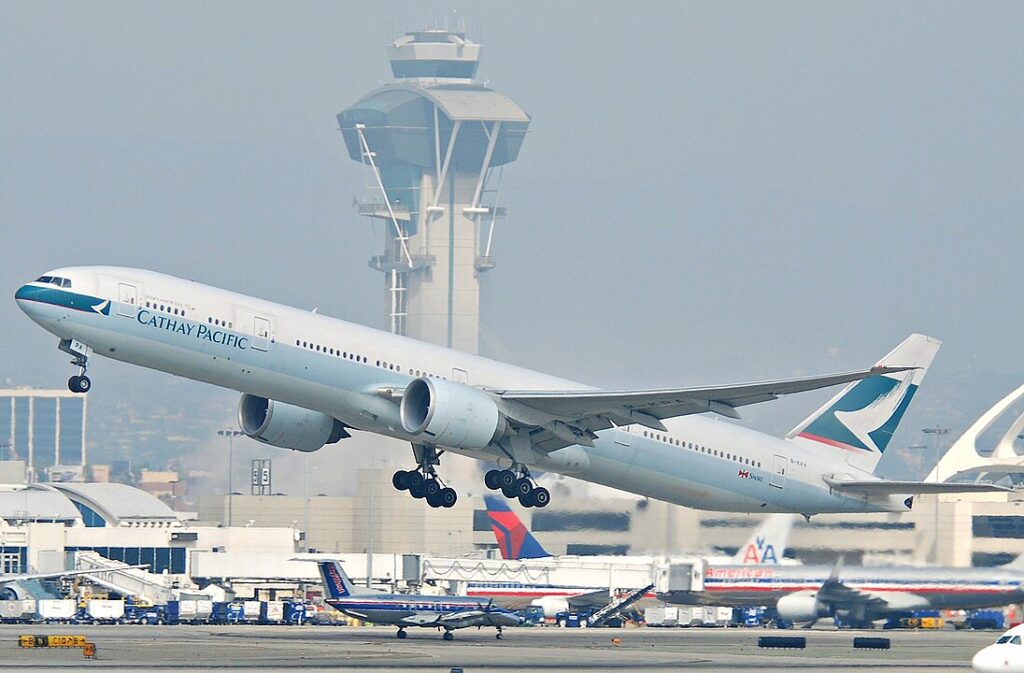
The airline primarily deploys Boeing 777-300, Airbus A350-900, Airbus A330-300, and Airbus A321neo aircraft on these routes, competing with carriers like Hong Kong Airlines (HX), Japan Airlines (JL), Air China (CA), and Singapore Airlines (SQ).
Cathay Pacific Top 30 Short/Medium-Haul Routes
According to MOXI (Market Outlook & eXpansion Index) scores, which reflect growth and competitive dynamics, Cathay Pacific (CX) top strongest performing short/medium-haul routes include:
| Rank | Route | MOXI Score | P2P Traffic | Evolution | Market Share | Share Change | Key Metrics |
|---|---|---|---|---|---|---|---|
| 1 | Hong Kong (HKG) – Singapore (SIN) | 7.5 | 715,000 | +346,000 | 57% | +15% | Strong market share growth |
| 2 | Hong Kong (HKG) – Taipei (TPE) | 7.5 | 1,029,000 | +558,000 | 36% | +6% | Highest passenger volume |
| 3 | Hong Kong (HKG) – Beijing (PEK) | 7.4 | 351,000 | +167,000 | 38% | -5% | Strong growth despite share decline |
| 4 | Hong Kong (HKG) – Tokyo (NRT/HND) | 7.2 | 637,000 | +259,000 | 38% | 0% | Stable market position |
| 5 | Hong Kong (HKG) – Bangkok (BKK) | 7.1 | 576,000 | +197,000 | 29% | +2% | Moderate share growth |
| 6 | Hong Kong (HKG) – Hangzhou (HGH) | 6.9 | 114,000 | +55,000 | 34% | +2% | Positive share development |
| 7 | Hong Kong (HKG) – Sapporo (CTS) | 6.9 | 128,000 | +55,000 | 76% | +15% | Strong niche position |
| 8 | Hong Kong (HKG) – Manila (MNL) | 6.8 | 264,000 | +68,000 | 39% | +2% | Stable growth |
| 9 | Hong Kong (HKG) – Surabaya (SUB) | 6.8 | 68,000 | +19,000 | 100% | 0% | Monopoly position |
| 10 | Hong Kong (HKG) – Kaohsiung (KHH) | 6.8 | 295,000 | +152,000 | 52% | -3% | Strong volume despite share loss |
| 11 | Hong Kong (HKG) – Shanghai (PVG/SHA) | 6.7 | 727,000 | +287,000 | 40% | -11% | Second highest volume route |
| 12 | Hong Kong (HKG) – Kuala Lumpur (KUL) | 6.6 | 264,000 | +130,000 | 42% | -4% | Strong growth, slight share decline |
| 13 | Hong Kong (HKG) – Osaka (KIX) | 6.5 | 371,000 | +136,000 | 32% | -7% | Competitive market |
| 14 | Hong Kong (HKG) – Jakarta (CGK) | 6.5 | 210,000 | +58,000 | 74% | +4% | Dominant position |
| 15 | Hong Kong (HKG) – Mumbai (BOM) | 6.5 | 82,000 | +24,000 | 100% | 0% | Exclusive service |
| 16 | Taipei (TPE) – Tokyo (NRT/HND) | 6.4 | 151,000 | +92,000 | 4% | +2% | Minor player, growing share |
| 17 | Hong Kong (HKG) – Kathmandu (KTM) | 6.4 | 26,000 | +10,000 | 84% | +13% | Strong niche growth |
| 18 | Hong Kong (HKG) – Ho Chi Minh (SGN) | 6.2 | 132,000 | +26,000 | 73% | +3% | Dominant position |
| 19 | Osaka (KIX) – Taipei (TPE) | 6.2 | 116,000 | +80,000 | 8% | +4% | Minor player, growing share |
| 20 | Bengaluru (BLR) – Hong Kong (HKG) | 6.2 | 28,000 | +10,000 | 100% | 0% | Exclusive service |
| 21 | Hong Kong (HKG) – Penang (PEN) | 6.1 | 73,000 | +29,000 | 73% | -17% | Significant share loss |
| 22 | Fukuoka (FUK) – Hong Kong (HKG) | 6.0 | 132,000 | +56,000 | 30% | +1% | Stable position |
| 23 | Nagoya (NGO) – Taipei (TPE) | 5.9 | 99,000 | +97,000 | 22% | +22% | Strong growth and share gain |
| 24 | Hong Kong (HKG) – Phuket (HKT) | 5.7 | 116,000 | +34,000 | 35% | -8% | Share decline |
| 25 | Hong Kong (HKG) – Qingdao (TAO) | 5.7 | 69,000 | +44,000 | 72% | -25% | Severe share erosion |
| 26 | Hong Kong (HKG) – Seoul (ICN/GMP) | 5.6 | 359,000 | +89,000 | 22% | -14% | Competitive pressure |
| 27 | Hong Kong (HKG) – Delhi (DEL) | 5.6 | 72,000 | +8,000 | 55% | -28% | Significant share loss |
| 28 | Hong Kong (HKG) – Nagoya (NGO) | 5.6 | 102,000 | +64,000 | 37% | -9% | Growth with share decline |
| 29 | Denpasar-Bali (DPS) – Hong Kong (HKG) | 5.2 | 62,000 | +10,000 | 55% | -17% | Share erosion |
| 30 | Hong Kong (HKG) – Chengdu (CTU) | 4.7 | 87,000 | +17,000 | 33% | -11% | Weakest performer |
Notably, Hong Kong-Taipei represents the highest volume route with over 1 million point-to-point passengers and a significant growth of 558,000 additional passengers.
The Hong Kong-Singapore route demonstrates the strongest market share improvement, increasing by 15 percentage points.
Conversely, the Hong Kong-Chengdu route shows weaker performance with a MOXI score of 4.7 and declining market share (-11%), despite moderate passenger growth.
Routes where Cathay Pacific holds 100% market share include Hong Kong-Mumbai, Hong Kong-Surabaya, and Hong Kong-Bengaluru, indicating strategic niche positions in specific markets.
Long-Haul Network Performance
Cathay Pacific’s long-haul network (routes beyond 2,500nm) serves more than 5.5 million passengers annually, a 41% increase over the previous year, and represents 62% of the airline’s total ASK deployment.
This segment generated over $4.9 billion in ticket revenue during the last 12 months.
The carrier faces stronger competition in long-haul markets compared to regional routes:
- Asia-North America: 9% market share, ranked #3 behind United Airlines (UA) and Korean Air (KE)
- Asia-Europe: 6% market share, ranked #5 behind Lufthansa (LH) and Singapore Airlines (SQ)
- Asia-Oceania: 9% market share, ranked #3 behind Singapore Airlines (SQ) and Qantas (QF)
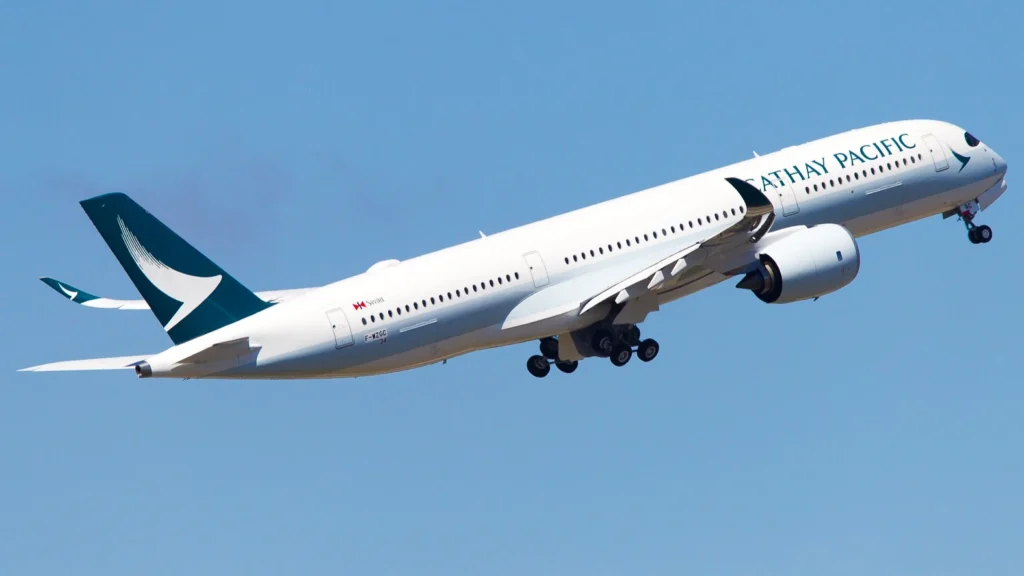
The airline primarily deploys Airbus A350-1000, Boeing 777-300, and Airbus A350-900 aircraft on these routes.
Cathay Pacific Top Long-Haul Routes
Based on MOXI scores, Cathay Pacific’s top-performing long-haul routes include:
| Rank | Route | MOXI Score | P2P Traffic | Evolution | Market Share | Share Change | Key Metrics |
|---|---|---|---|---|---|---|---|
| 1 | Hong Kong (HKG) – New York (JFK) | 7.0 | 170,000 | +67,000 | 99% | +6% | Near-monopoly position |
| 2 | Hong Kong (HKG) – Chicago (ORD) | 7.0 | 19,000 | +16,000 | 100% | +88% | Exclusive service, dramatic growth |
| 3 | Hong Kong (HKG) – Johannesburg (JNB) | 6.9 | 9,000 | +7,000 | 100% | 0% | Exclusive service |
| 4 | Hong Kong (HKG) – Boston (BOS) | 6.7 | 42,000 | +12,000 | 100% | 0% | Exclusive service |
| 5 | Hong Kong (HKG) – Toronto (YYZ) | 6.6 | 96,000 | +27,000 | 100% | 0% | Exclusive service |
| 6 | Hong Kong (HKG) – Sydney (SYD) | 6.5 | 176,000 | +43,000 | 77% | 0% | Dominant position |
| 7 | Hong Kong (HKG) – Brisbane (BNE) | 6.5 | 60,000 | +20,000 | 100% | 0% | Exclusive service |
| 8 | Barcelona (BCN) – Hong Kong (HKG) | 6.5 | 4,000 | +3,000 | 100% | +71% | New exclusive service |
| 9 | Hong Kong (HKG) – Parma (PMF) | 6.3 | 30,000 | +13,000 | 100% | 0% | Exclusive service |
| 10 | Auckland (AKL) – Hong Kong (HKG) | 6.2 | 29,000 | +13,000 | 43% | +6% | Growing market share |
| 11 | Hong Kong (HKG) – Perth (PER) | 6.1 | 44,000 | +17,000 | 100% | 0% | Exclusive service |
| 12 | Hong Kong (HKG) – Zurich (ZRH) | 6.0 | 20,000 | +9,000 | 35% | +4% | Share growth |
| 13 | Amsterdam (AMS) – Hong Kong (HKG) | 5.6 | 55,000 | +20,000 | 63% | -14% | Share erosion |
| 14 | Frankfurt (FRA) – Hong Kong (HKG) | 5.4 | 36,000 | +14,000 | 51% | +2% | Slight share growth |
| 15 | Hong Kong (HKG) – London (LHR) | 5.3 | 381,000 | +45,000 | 76% | -2% | Highest volume route |
| 16 | Hong Kong (HKG) – Madrid (MAD) | 5.3 | 12,000 | +3,000 | 100% | 0% | Exclusive service |
| 17 | Hong Kong (HKG) – Melbourne (MEL) | 5.2 | 127,000 | +23,000 | 75% | -19% | Significant share loss |
| 18 | Hong Kong (HKG) – Vancouver (YVR) | 5.1 | 72,000 | +7,000 | 51% | +1% | Competitive market |
| 19 | Hong Kong (HKG) – Manchester (MAN) | 4.9 | 58,000 | +9,000 | 100% | 0% | Exclusive service |
| 20 | Dubai (DXB) – Hong Kong (HKG) | 4.8 | 46,000 | +9,000 | 26% | -13% | Share decline |
| 21 | Hong Kong (HKG) – Los Angeles (LAX) | 4.5 | 52,000 | -13,000 | 70% | -29% | Traffic decline, share erosion |
| 22 | Hong Kong (HKG) – San Francisco (SFO) | 4.1 | 62,000 | +4,000 | 35% | -18% | Weak growth, share erosion |
| 23 | Hong Kong (HKG) – Paris (CDG) | 4.0 | 59,000 | +10,000 | 46% | -17% | Significant share loss |
The airline maintains exclusive service on several routes, including Hong Kong to Toronto, Boston, Brisbane, Perth, Parma, Manchester, Madrid, and Johannesburg.
Weaker performing routes include Hong Kong-Los Angeles (4.5), Hong Kong-San Francisco (4.1), and Hong Kong-Paris (4.0), all showing declining market share despite passenger growth.
These Cathay Pacific top routes face significant competitive pressure from other carriers.
Network Recovery and Strategic Positioning
Cathay Pacific’s network strategy reveals a clear focus on rebuilding capacity while addressing competitive pressures from mainland Chinese carriers and Middle Eastern airlines.
The carrier has maintained market leadership in regional routes while strategically deploying its fleet to maximize efficiency on long-haul sectors.
According to AvBench Data, with 62% of total Available Seat Kilometers (ASK) deployed on long-haul routes generating over $4.9 billion in ticket revenue, the airline’s recovery continues to progress despite varying performance across different market segments.
Fleet Performance
Cathay Pacific’s fleet strategy presents both opportunities and challenges across its varied aircraft types.
Boeing 777-300: 55 aircraft with an average age of 15.4 years and 343 seats. While deployed on longer routes than the A330 (average 2,500nm vs. 900nm), it operates relatively few cycles (approximately 500/year) but faces less competitive pressure.
Airbus A330-300: 43 aircraft with an average age of 16.1 years and 288 seats. Primarily serving Chinese domestic routes and competing against narrowbody aircraft, the A330 struggles with cost competitiveness despite low ownership costs.
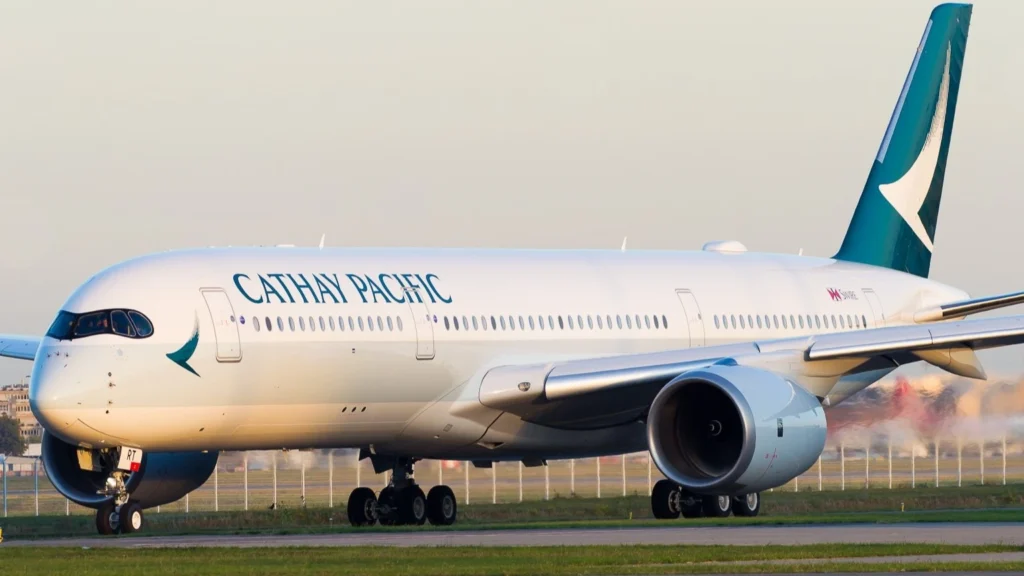
Airbus A350-900: 30 aircraft with an average age of 6.6 years and 252 seats. Currently the best-performing widebody type, operating on shorter routes (2,700nm) but showing stronger market share growth potential than the A350-1000.
Airbus A350-1000: 18 aircraft with an average age of 4.9 years and 302 seats. Effective on specific long-haul routes like Toronto, New York, and Boston, but with less overall network impact than the A350-900.
Airbus A321neo: 13 aircraft with an average age of 2.3 years and 202 seats. Despite sub-optimal fleet size and utilization, this type demonstrates significant profitability potential with strong cost and yield performance.
The airline has placed orders for 18 additional A321neo, 30 A330-900neo, and 21 Boeing 777-9 aircraft, signaling significant fleet renewal plans.
Performance metrics across the fleet show the A321neo achieving the highest COFI (Commercial & Operational Fit Index) score of 9.1, followed by the A350-900 at 5.8, indicating these types are best matched to their current deployment patterns.

Methodology & Data Sources
The performance metrics used in this analysis by AvBench include Traffic, Revenue & Schedule Data from Milanamos and Fleet Data from ch-aviation.
Market Outlook & eXpansion Index (MOXI): Measures growth and competitive dynamics on routes, assessing both passenger volume evolution and market share performance. Routes are scored from 0-10 based on traffic gains and market share metrics.
Commercial & Operational Fit Index (COFI): Reflects overall commercial and operational performance of aircraft types within the airline’s network, considering factors such as market share, revenue performance, competitive pressure, yield, cost efficiency, utilization, and network maturity.
Sub-indices include Passenger Market Share Performance (PMP), Revenue Market Share Performance (RMP), Network Aggressiveness (NA), Yield Performance (YP), Cost/Seat Performance (CP), Aircraft Utilization (AU), and Network Maturity (NM).
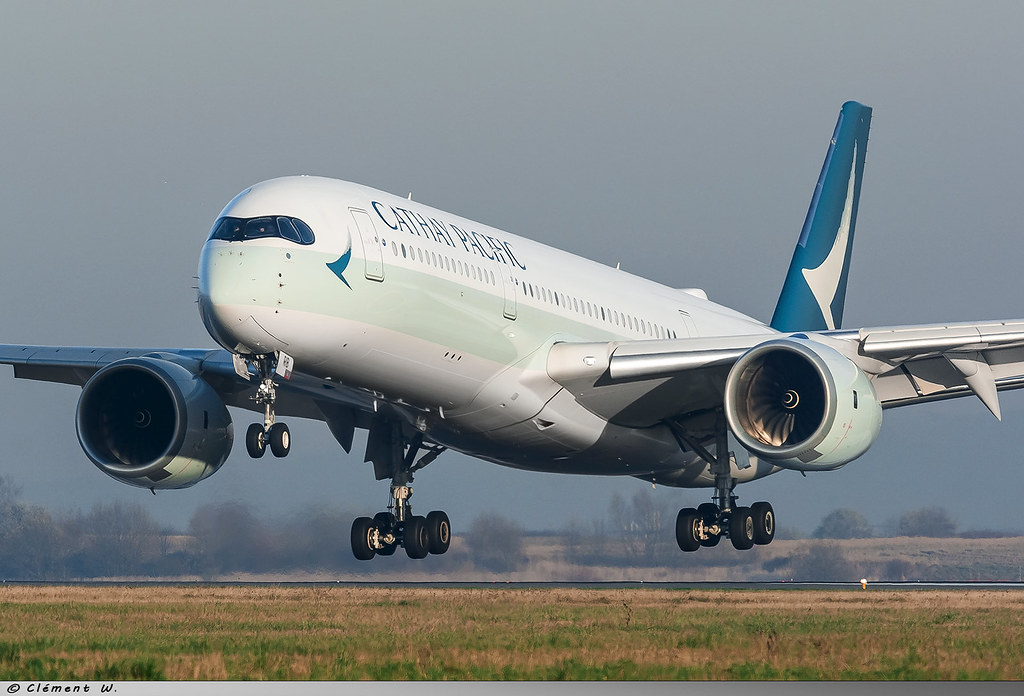
Featured Image by Clément Alloing | Flickr
Stay tuned with us. Further, follow us on social media for the latest updates.
Join us on Telegram Group for the Latest Aviation Updates. Subsequently, follow us on Google News