LONDON- A new policy brief from ODI Global has placed Dubai International Airport (DXB) and London Heathrow Airport (LHR) at the top of the world’s highest-emitting airports, with the 20 largest contributing 27.3% of total aviation CO2 emissions in 2023. The findings come as global aviation emissions approach pre-pandemic levels across all regions.
The Airport Tracker analysis, covering 1,300 airports worldwide, shows airports in just 20 countries account for 78% of global aviation CO2 emissions.
Carriers such as Emirates (EK), British Airways (BA), American Airlines (AA), and Singapore Airlines (SQ) operate the bulk of long-haul flights from these top-emitting hubs, with the United States and China together responsible for nearly 40% of the global total.
Global Aviation Emissions Reach 1,026 Million Tonnes
The aviation sector currently accounts for approximately 2.5% of global energy-related CO2 emissions. When non-CO2 climate impacts are included, the sector is responsible for around 4% of global warming to date.
If aviation were classified as a country, it would rank as the fifth-largest national emitter globally. The 1,300 airports tracked in the analysis generated 1,026 million tonnes of CO2 across 34.6 million flights in 2023, ODI Global reported.
Hard-to-Abate Sector Comparison (2023-2024)
Aviation recorded the largest percentage increase in both activity and emissions among hard-to-abate sectors between 2023 and 2024.
| Sector | Activity (2024) | YoY Activity Change | Emissions (Gt CO2) | YoY Emissions Change |
|---|---|---|---|---|
| Aviation | 8.8 trillion revenue passenger-km | +10.4% | 1.108 | +6.4% |
| Shipping | 121.7 trillion tonne-km | +5.5% | 0.847 | +2.7% |
| Trucking | 35.1 trillion tonne-km | +1.3% | 1.968 | +0.6% |
| Steel | 1,883 million tonnes | -1.1% | 2.750 | -0.4% |
| Aluminium | 113 million tonnes | +4.6% | 1.162 | +4.1% |
| Cement | 3,950 million tonnes | -3.9% | 2.324 | -3.5% |
| Primary Chemicals | 754 million tonnes | +3.0% | 0.971 | +2.3% |
| Oil and Gas | 103M barrels/day; 411B cubic ft/day | +4.0% / +1.5% | 5.100 | -6.4% |
Regional Breakdown of Aviation Emissions
Asia-Pacific leads global aviation emissions, followed by North America and Europe. These three regions combined produce more emissions than Latin America, the Middle East, and Africa together.
| Region | CO2 Emissions (Million Tonnes) | % of Total Emissions | Flights (Million) | % of Total Flights |
|---|---|---|---|---|
| Asia-Pacific | 331.6 | 32% | 10.4 | 30% |
| North America | 281.8 | 27% | 11.2 | 33% |
| Europe | 245.9 | 24% | 8.3 | 24% |
| Latin America/Caribbean | 67.2 | 7% | 2.7 | 8% |
| Middle East | 71.6 | 7% | 1.2 | 4% |
| Africa | 27.6 | 3% | 0.7 | 2% |
Top 20 Highest-Emitting Airports in 2023
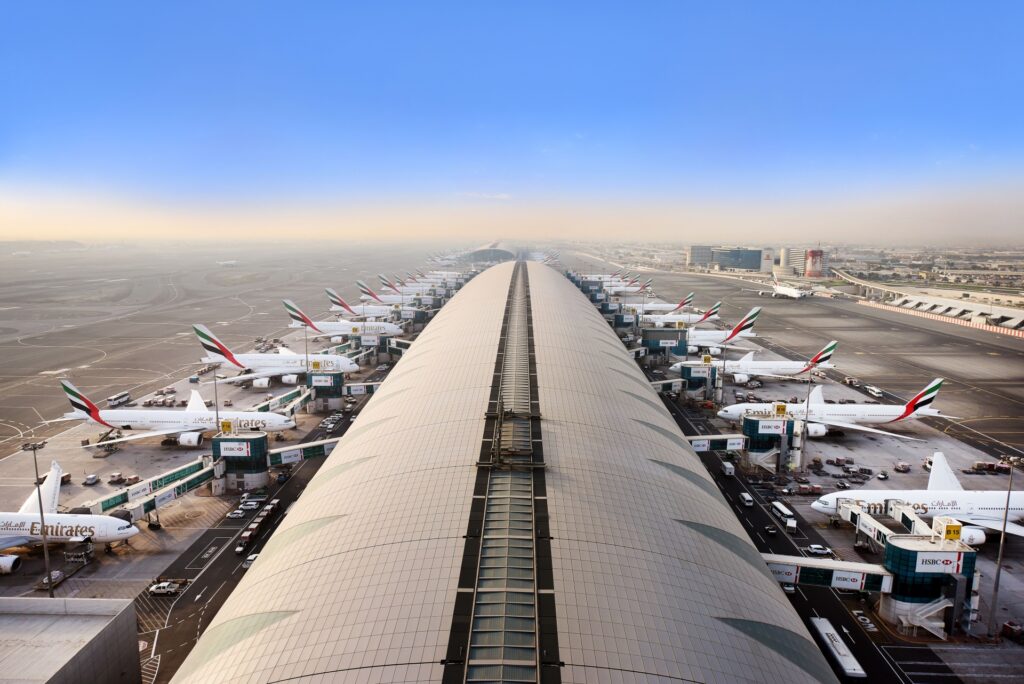
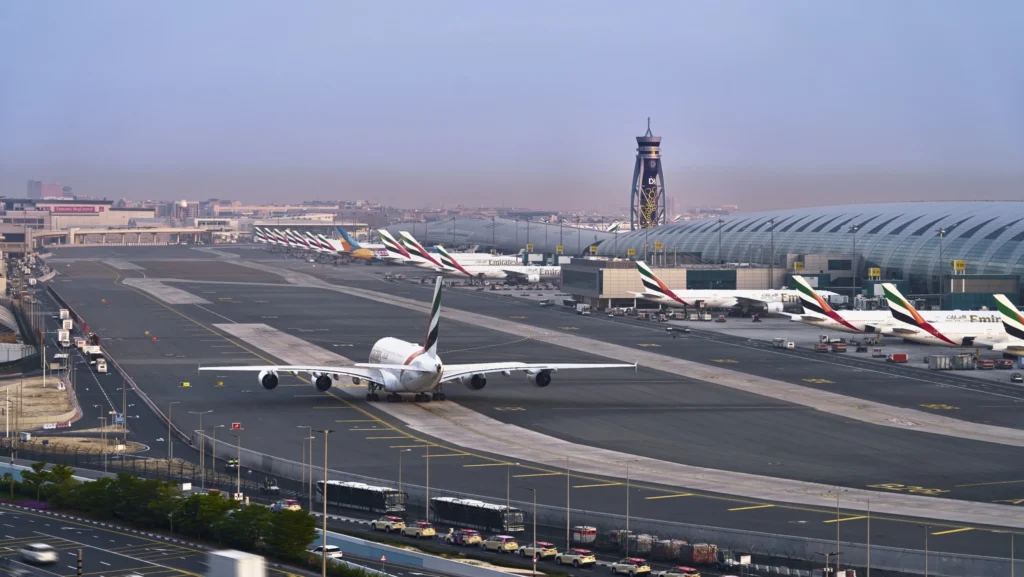
Dubai International Airport (DXB) tops the global list with 23.2 million tonnes of CO2, followed by London Heathrow (LHR) at 21.0 million tonnes. Eight of the top 20 airports are located in the United States, and 18 sit in high-income countries.
| Rank | Airport Name | IATA Code | Country/Territory | ICAO Region | CO2 (Million Tonnes) |
|---|---|---|---|---|---|
| 1 | Dubai International | DXB | United Arab Emirates | Middle East | 23.2 |
| 2 | London Heathrow | LHR | United Kingdom | Europe | 21.0 |
| 3 | Los Angeles International | LAX | United States | North America | 18.8 |
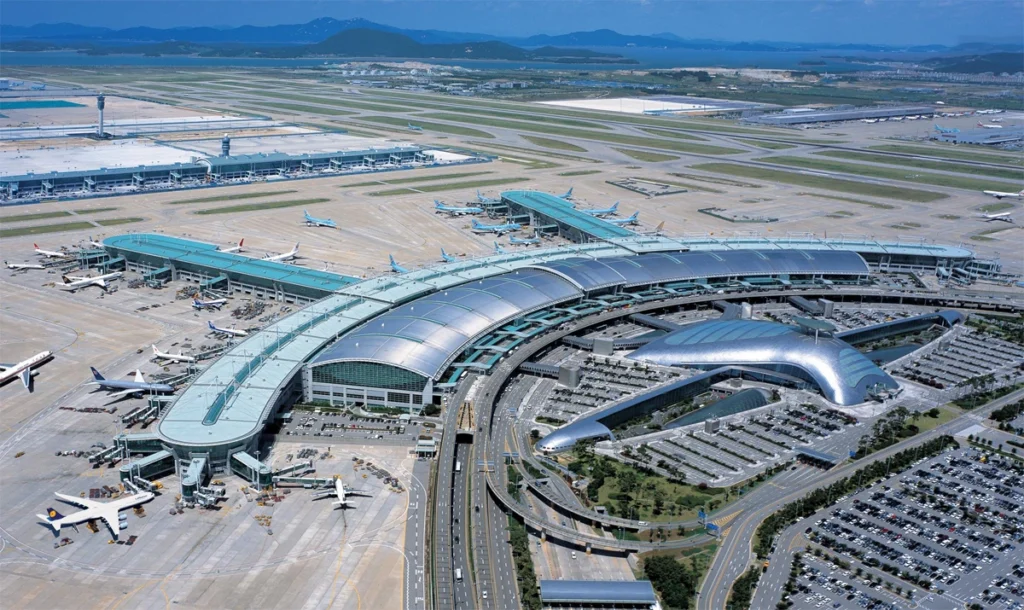
| 4 | Seoul Incheon | ICN | South Korea | Asia/Pacific | 16.8 |
| 5 | New York John F. Kennedy | JFK | United States | North America | 16.8 |
| 6 | Hong Kong International | HKG | China | Asia/Pacific | 15.1 |
| 7 | Paris Charles de Gaulle | CDG | France | Europe | 14.7 |
| 8 | Frankfurt | FRA | Germany | Europe | 14.4 |
| 9 | Singapore Changi | SIN | Singapore | Asia/Pacific | 14.3 |
| 10 | Doha Hamad | DOH | Qatar | Middle East | 14.0 |
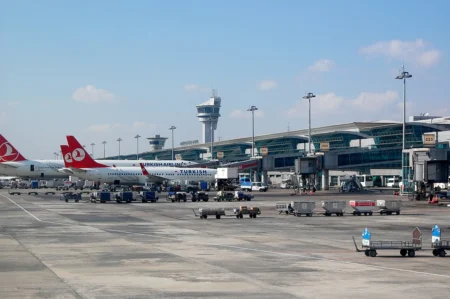
| 11 | Istanbul | IST | Türkiye | Europe | 12.8 |
| 12 | Shanghai Pudong | PVG | China | Asia/Pacific | 12.4 |
| 13 | Chicago O’Hare | ORD | United States | North America | 12.4 |
| 14 | San Francisco | SFO | United States | North America | 11.9 |
| 15 | Amsterdam Schiphol | AMS | Netherlands | Europe | 11.0 |
| 16 | Tokyo Haneda | HND | Japan | Asia/Pacific | 10.8 |
| 17 | Atlanta Hartsfield-Jackson | ATL | United States | North America | 10.6 |
| 18 | Anchorage | ANC | United States | North America | 9.9 |
| 19 | Miami International | MIA | United States | North America | 9.7 |
| 20 | Dallas/Fort Worth | DFW | United States | North America | 9.4 |

Country-Level Aviation Emissions Rankings
The United States and China together account for nearly 40% of global airport CO2 emissions. The remaining 173 countries combined produce just 22% of total emissions.
| Rank | Country | CO2 (Million Tonnes) | % of Total | Cumulative % |
|---|---|---|---|---|
| 1 | United States | 259.4 | 25% | 25% |
| 2 | China | 138.2 | 13% | 39% |
| 3 | United Kingdom | 38.5 | 4% | 43% |
| 4 | Japan | 32.0 | 3% | 46% |
| 5 | United Arab Emirates | 31.1 | 3% | 49% |
| 6 | Germany | 29.0 | 3% | 52% |
| 7 | India | 27.6 | 3% | 54% |
| 8 | Spain | 24.7 | 2% | 57% |
| 9 | France | 23.6 | 2% | 59% |
| 10 | Australia | 22.0 | 2% | 61% |
| 11 | Canada | 22.0 | 2% | 63% |
| 12 | Türkiye | 20.9 | 2% | 65% |
| 13 | South Korea | 19.8 | 2% | 67% |
| 14 | Russia | 18.4 | 2% | 69% |
| 15 | Brazil | 17.8 | 2% | 71% |
| 16 | Italy | 16.1 | 2% | 72% |
| 17 | Mexico | 15.5 | 2% | 74% |
| 18 | Singapore | 14.3 | 1% | 75% |
| 19 | Qatar | 14.0 | 1% | 77% |
| 20 | Thailand | 13.7 | 1% | 78% |
| – | Rest of World | 226.9 | 22% | 100% |

Top 20 Airports by Flight Volume
Nine of the ten busiest airports by flight count are located in the United States, reflecting the country’s extensive domestic network and higher proportion of short-haul flights.
| Rank | Airport Name | IATA Code | Country/Territory | ICAO Region | Number of Flights |
|---|---|---|---|---|---|
| 1 | Atlanta Hartsfield-Jackson | ATL | United States | North America | 391,183 |
| 2 | Chicago O’Hare | ORD | United States | North America | 363,173 |
| 3 | Dallas/Fort Worth | DFW | United States | North America | 348,035 |
| 4 | Denver International | DEN | United States | North America | 332,071 |
| 5 | Los Angeles International | LAX | United States | North America | 288,622 |
| 6 | Charlotte Douglas | CLT | United States | North America | 264,183 |
| 7 | Las Vegas Harry Reid | LAS | United States | North America | 252,170 |
| 8 | Istanbul | IST | Türkiye | Europe | 249,788 |
| 9 | New York John F. Kennedy | JFK | United States | North America | 240,978 |
| 10 | Miami International | MIA | United States | North America | 231,068 |
| 11 | London Heathrow | LHR | United Kingdom | Europe | 229,941 |
| 12 | Amsterdam Schiphol | AMS | Netherlands | Europe | 228,994 |
| 13 | Tokyo Haneda | HND | Japan | Asia/Pacific | 228,361 |
| 14 | Paris Charles de Gaulle | CDG | France | Europe | 228,131 |
| 15 | Delhi Indira Gandhi | DEL | India | Asia/Pacific | 225,068 |
| 16 | Phoenix Sky Harbor | PHX | United States | North America | 222,634 |
| 17 | Guangzhou Baiyun | CAN | China | Asia/Pacific | 222,196 |
| 18 | Newark Liberty | EWR | United States | North America | 218,540 |
| 19 | Shanghai Pudong | PVG | China | Asia/Pacific | 215,210 |
| 20 | Frankfurt | FRA | Germany | Europe | 214,577 |
Top 20 Cities by Aggregated Airport Emissions
London (LON) tops city-level rankings with six airports handling over 547,000 flights and generating 29.2 million tonnes of CO2. The top 20 cities account for 32% of global airport emissions.
| Rank | City | City Code | Airports | Flights | CO2 (Million Tonnes) | NOx (Tonnes) | HC (Tonnes) | CO (Tonnes) | PM2.5 (Tonnes) |
|---|---|---|---|---|---|---|---|---|---|
| 1 | London | LON | 6 | 547,501 | 29.2 | 9,571 | 556 | 5,910 | 36 |
| 2 | New York City | NYC | 4 | 651,054 | 28.5 | 8,865 | 535 | 5,873 | 38 |
| 3 | Dubai | DXB | 2 | 227,127 | 24.8 | 8,039 | 498 | 4,764 | 20 |
| 4 | Tokyo | TYO | 2 | 333,164 | 19.8 | 7,501 | 410 | 4,283 | 24 |
| 5 | Los Angeles | LAX | 2 | 323,307 | 19.1 | 5,083 | 486 | 3,533 | 23 |
| 6 | Paris | PAR | 4 | 376,808 | 18.6 | 6,314 | 526 | 4,528 | 24 |
| 7 | Seoul | SEL | 2 | 241,712 | 17.8 | 5,690 | 299 | 3,233 | 22 |
| 8 | Shanghai | SHA | 2 | 347,765 | 16.7 | 6,924 | 390 | 4,368 | 27 |
| 9 | Hong Kong | HKG | 1 | 138,764 | 15.1 | 4,572 | 245 | 2,535 | 14 |
| 10 | Istanbul | IST | 2 | 365,004 | 15.0 | 6,276 | 353 | 3,811 | 30 |
| 11 | Frankfurt | FRA | 2 | 221,794 | 14.8 | 4,197 | 250 | 2,716 | 19 |
| 12 | Singapore | SIN | 1 | 164,862 | 14.3 | 4,501 | 188 | 2,316 | 15 |
| 13 | Chicago | CHI | 2 | 475,277 | 14.1 | 4,949 | 442 | 4,173 | 24 |
| 14 | Doha | DOH | 1 | 124,340 | 14.0 | 4,569 | 200 | 2,287 | 10 |
| 15 | Beijing | BJS | 2 | 333,083 | 13.2 | 6,011 | 365 | 3,935 | 25 |
| 16 | San Francisco | SFO | 1 | 189,762 | 11.9 | 3,112 | 184 | 1,906 | 13 |
| 17 | Amsterdam | AMS | 1 | 228,994 | 11.0 | 3,251 | 292 | 2,708 | 12 |
| 18 | Dallas Fort Worth | DFW | 2 | 469,594 | 10.9 | 4,722 | 456 | 3,749 | 30 |
| 19 | Bangkok | BKK | 2 | 246,246 | 10.8 | 4,740 | 274 | 2,918 | 19 |
| 20 | Atlanta | ATL | 2 | 420,658 | 10.7 | 4,884 | 384 | 3,991 | 25 |

Top 20 Airports by Local Air Pollutants (LTO Cycle)
Dubai (DXB) leads in three of four pollutant categories, while Istanbul (IST) records the highest PM2.5 levels.
| Rank | NOx Leader | Tonnes | HC Leader | Tonnes | CO Leader | Tonnes | PM2.5 Leader | Tonnes |
|---|---|---|---|---|---|---|---|---|
| 1 | Dubai (DXB) | 7,577 | Dubai (DXB) | 444 | Dubai (DXB) | 4,404 | Istanbul (IST) | 25.8 |
| 2 | London Heathrow (LHR) | 6,030 | Los Angeles (LAX) | 340 | Atlanta (ATL) | 3,663 | Dallas/Fort Worth (DFW) | 24.1 |
| 3 | Istanbul (IST) | 5,018 | Teterboro (TEB) | 316 | Chicago O’Hare (ORD) | 3,207 | Atlanta (ATL) | 23.0 |
| 4 | Los Angeles (LAX) | 4,866 | Paris CDG (CDG) | 314 | Los Angeles (LAX) | 3,101 | Los Angeles (LAX) | 20.3 |
| 5 | Tokyo Haneda (HND) | 4,826 | Istanbul (IST) | 295 | Paris CDG (CDG) | 3,085 | London Heathrow (LHR) | 20.2 |
| 6 | Seoul Incheon (ICN) | 4,800 | Amsterdam (AMS) | 292 | Istanbul (IST) | 2,948 | Chicago O’Hare (ORD) | 19.4 |
| 7 | Atlanta (ATL) | 4,756 | Chicago O’Hare (ORD) | 288 | London Heathrow (LHR) | 2,829 | Frankfurt (FRA) | 18.8 |
| 8 | Paris CDG (CDG) | 4,666 | Las Vegas (LAS) | 280 | Tokyo Haneda (HND) | 2,797 | Denver (DEN) | 18.0 |
| 9 | Hong Kong (HKG) | 4,572 | Tokyo Haneda (HND) | 279 | Shanghai Pudong (PVG) | 2,740 | Dubai (DXB) | 17.9 |
| 10 | Doha Hamad (DOH) | 4,569 | Atlanta (ATL) | 273 | New York JFK (JFK) | 2,733 | Charlotte (CLT) | 17.3 |
| 11 | Singapore Changi (SIN) | 4,501 | New York JFK (JFK) | 263 | Amsterdam (AMS) | 2,708 | New York JFK (JFK) | 17.0 |
| 12 | New York JFK (JFK) | 4,474 | Miami (MIA) | 258 | Guangzhou (CAN) | 2,665 | Shanghai Pudong (PVG) | 16.6 |
| 13 | Shanghai Pudong (PVG) | 4,193 | Guangzhou (CAN) | 253 | Seoul Incheon (ICN) | 2,649 | Tokyo Haneda (HND) | 16.0 |
| 14 | Guangzhou (CAN) | 4,082 | Seoul Incheon (ICN) | 250 | Dallas/Fort Worth (DFW) | 2,632 | Seoul Incheon (ICN) | 15.8 |
| 15 | Frankfurt (FRA) | 4,080 | Shanghai Pudong (PVG) | 248 | Frankfurt (FRA) | 2,620 | Orlando (MCO) | 15.1 |
| 16 | Chicago O’Hare (ORD) | 3,964 | Hong Kong (HKG) | 245 | Denver (DEN) | 2,618 | Singapore Changi (SIN) | 15.0 |
| 17 | Beijing Capital (PEK) | 3,926 | Frankfurt (FRA) | 238 | Hong Kong (HKG) | 2,535 | Shenzhen (SZX) | 14.9 |
| 18 | Dallas/Fort Worth (DFW) | 3,777 | Dallas/Fort Worth (DFW) | 235 | Beijing Capital (PEK) | 2,485 | Paris CDG (CDG) | 14.9 |
| 19 | Bangkok (BKK) | 3,689 | Beijing Capital (PEK) | 228 | Miami (MIA) | 2,324 | Beijing Capital (PEK) | 14.6 |
| 20 | Miami (MIA) | 3,381 | Denver (DEN) | 222 | Singapore Changi (SIN) | 2,316 | Guangzhou (CAN) | 14.5 |
Flight Type and Climate Impact Distribution
Passenger flights dominate both flight volume and climate impact, while freight flights produce disproportionate emissions relative to their numbers.
| Flight Category | % of Total Flights | % of Climate Impact |
|---|---|---|
| Passenger | 90% | 87% |
| Freight | 4% | 11% |
| Private Jet | 6% | 2% |
Flight Distance and Emissions Impact
Long-haul flights represent a small share of total flights but generate a disproportionate share of CO2 emissions.
| Flight Distance | % of Total Flights | % of CO2 Emissions |
|---|---|---|
| Short-haul | 63% | – |
| Medium-haul | 30% | – |
| Long-haul | 7% | 40% |
Airport Carbon Accreditation Status (March 2026)
| Accreditation Level | Number of Airports | % of Tracked Airports |
|---|---|---|
| Total accredited (all levels) | 650 | 50.0% |
| Level 5 (Net-zero Scope 3 by 2050) | 30 | 2.3% |
Stay tuned with us. Further, follow us on social media for the latest updates.
Join us on Telegram Group for the Latest Aviation Updates. Subsequently, follow us on Google News